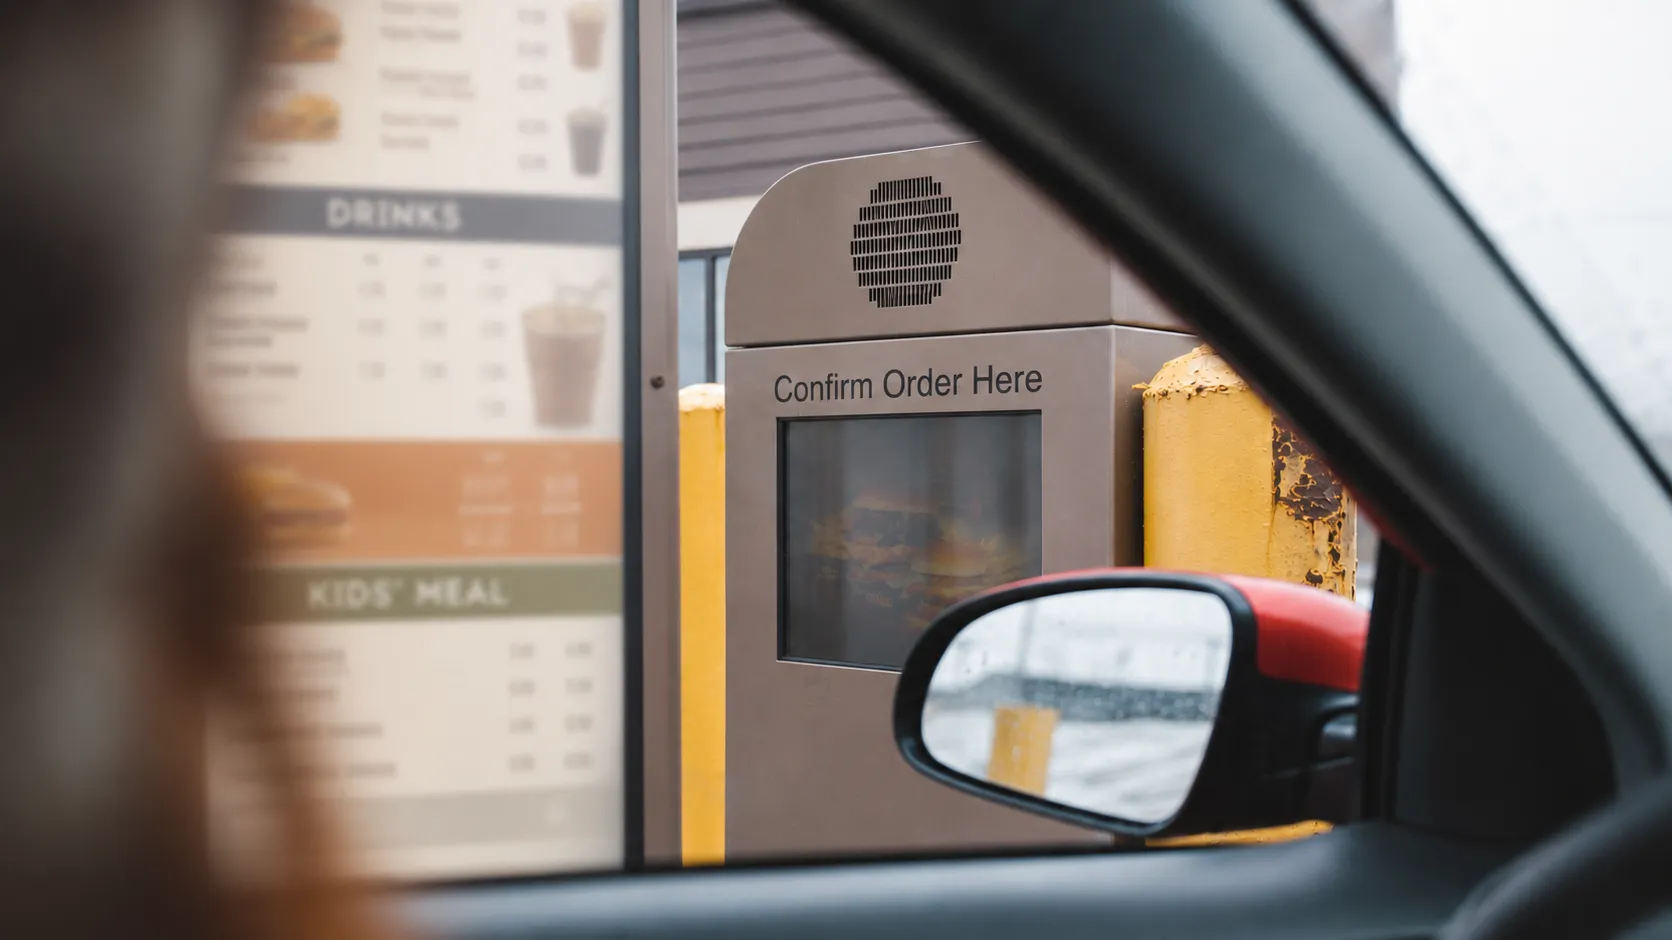
Drive-Thru Speed of Service: How Seconds Become Revenue
Drive-thru speed is one of the most direct levers on revenue in QSR; this is what the seconds are worth, what wait time costs a business, and how to find the seconds your lanes are losing.
Shave 15 to 20 seconds off drive-thru service and sales rise 2 to 3%. Bring wait times down across an operation and the lift can reach 15%: we have watched clients hit that number by improving nothing but speed. Think of it as capacity. The faster one car clears the lane, the sooner the next one can pull up, and during a rush, that turnaround is your revenue. Read through our key points below to learn what a second is worth in your lanes, where the time goes, and how to improve your drive-thru speed of service.
The Economics of a Second in the Drive-Thru
The industry measures speed of service from the moment a car reaches the menu board to the moment it drives off. The industry’s benchmark study, Intouch Insight’s 25th Annual Drive-Thru Study, clocks the whole visit. They timed 165 visits at each of 13 national brands in the summer of 2025 and found the average car spends 5 minutes 35 seconds in the lane from entry to exit.
A 15-20 second reduction in service time can lead to a 2-3% gain in sales, because a faster lane serves more cars in the same hours with the same kitchen. Across a group of 20 or 50 locations, a 2- 3% lift from speed alone is considerable.
What the Wait Costs: Drive-Offs and the Cars That Never Line Up
The cost of a slow lane appears in two places, and neither is on a standard report. The first is the drive-off: the customer who joins the line, waits, gives up, and pulls out. That was revenue you had and lost. The second is the car that slows at the entrance, checks the length of the line, and keeps going. No order was started so no system recorded a loss, but a customer made a purchase decision about your location and moved on.
These decisions can harden into consumer habits, too. One in three fast-food customers has switched brands or stopped visiting a location because of long waits: a figure we share with operators in our own speed of service work. A slow lane loses today’s order and tells the customer to go elsewhere next time.
Some locations have fewer cars on average in line than in 2018, but each transaction has grown in value coupled with mobile orders and customizations. On average, lines have reduced in length while the work per car has increased. Speed today is a throughput problem, and throughput is improved with people and efficient processes.
The District Manager Who Purposely Overstaffed the Lane
A district manager we worked alongside had a routine habit: wherever he took over, he hired two or three extra people whose sole job was the drive-thru. If the labor model called for six staff on a shift, he ran eight or nine. His payroll line was the highest in the district, and he heard about it constantly, but his revenue ran 10, 11, or even 12% ahead, because his lane pushed more cars per hour than anyone else’s. He called it his “cheat code”.
Managers would read his schedule and balk at the overhead, but he read the other side of the ledger by pricing in the added throughput return. Payroll appears on the P&L in the same week you spend it, but the cars you never serve don’t appear at all, which is why staffing for speed keeps looking like a cost when it performs like an investment.
How the Drive-Thru Timer Alone Can Mislead You
Every drive-thru has a timer and the timer is useful until the number becomes the goal. When a team is graded on the clock during busy hours, high volume often makes the target impossible to achieve, so serving the clock can seem like the rational move. The common example is pulling cars: a vehicle waiting on a made-to-order item is directed to a waiting bay, the timer stops, and the dashboard records a fast transaction while the customer sits in a parking space waiting.
A timer measures a specific segment while the customer experiences the whole visit. Check reported speed against what a customer sees from joining the line to leaving with a complete order, and read it alongside your customer experience monitoring. When the two figures disagree, the customer’s version is correct.
What Doesn’t Buy Speed: The Ordering Technology Test
New ordering technology is sold on speed, and on a per-transaction stopwatch it can deliver. In the same Intouch Insight study, lanes using voice-ordering systems averaged 21 seconds faster service than the study overall. But 34% of customers had to repeat their order and about one in five orders had to be handed to an employee to finish. Repeats are expensive, and customers in the study who did not have to repeat an order saved an average of 1 minute 25 seconds.
In our observation, the strongest voice-ordering systems move 8-10 cars per hour, but this is still fewer than a well-trained team member who can take 15 or more. Per-car time and cars-per-hour are different metrics: a lane can clock quick individual transactions but still serve fewer customers overall. Technology is valuable where it supports the team, and speed is achieved through people and process together.
Finding Your Seconds: A Four-Step Speed of Service Review
Follow this sequence to find the seconds you can gain by improving your speed of service:
- Staff against your busiest hours, not your average ones. A labor model built on mean hourly volume understaffs the lane at the exact moment the most cars are waiting, and this rush will determine your revenue for the day. Schedule staffing to peak hours, the way our district manager did, and price the added labor against the cars it serves.
- Find which ordering stage has the delay. Is it the line before the speaker, the order, the payment, or the pickup window causing the delay? Until you know whether it’s your wait time or service time that’s causing the queue, you can’t apply a meaningful fix.
- Measure what the customer sees. Time the visit from entering the lane to driving off with a complete order. This is what your customers see and how they will decide whether to visit again.
- Ask why, not just how long. A window that runs slow at the same daypart every day has a cause, for example a staffing gap or faulty equipment. Conduct daily reviews across a full week to identify the pattern and cause. This is the work our analysts do in speed of service monitoring.
Turning Drive-Thru Seconds Into Revenue
Our analysts track speed of service patterns daily across client locations: which stage of the lane is slowing, at which daypart, and what is driving it. Monitoring runs continuously, so you find out what’s causing it while the person or the process is still on this week’s schedule, footage and data attached. That is how speed stops being a stopwatch reading and becomes a revenue exercise.
See how operational excellence monitoring works across 700+ businesses, or book a call to discuss speed of service on your drive-thru lanes.
What QSR Operators Ask Us About Drive-Thru Speed
What is a good drive-thru time?
The 2025 benchmark average is 5 minutes 35 seconds in the lane from entry to exit, with an average wait of 1 minute 21 seconds before ordering. Every brand has different measures of what is ‘good’ and there is some variation in that figure. Benchmarks set the context; the more useful number is your own trend. A location that has drifted 30 seconds slower over a quarter has a cause you can find and fix.
How much revenue does a faster drive-thru add?
The working conversion is 2 to 3% in sales for every 15 to 20 seconds of service time recovered. Operations that bring wait times down across the board have seen lifts around 15%. The gains come from throughput: more cars served in the same hours, with the same kitchen and the same four walls.
Does automated voice ordering make the drive-thru faster?
Per transaction, it can: benchmark data shows voice-ordering lanes running 21 seconds faster on average. Per hour, a trained order-taker still moves more cars through the lane, and a third of customers at those lanes have to repeat their orders. Judge any ordering technology on cars served per hour, not on the per-transaction stopwatch.